


Centralize and monitor your apps in real-time

Stackpulse watches the official status pages of 7,900+ services, from GitHub to Stripe, and tells you when one of yours goes down.

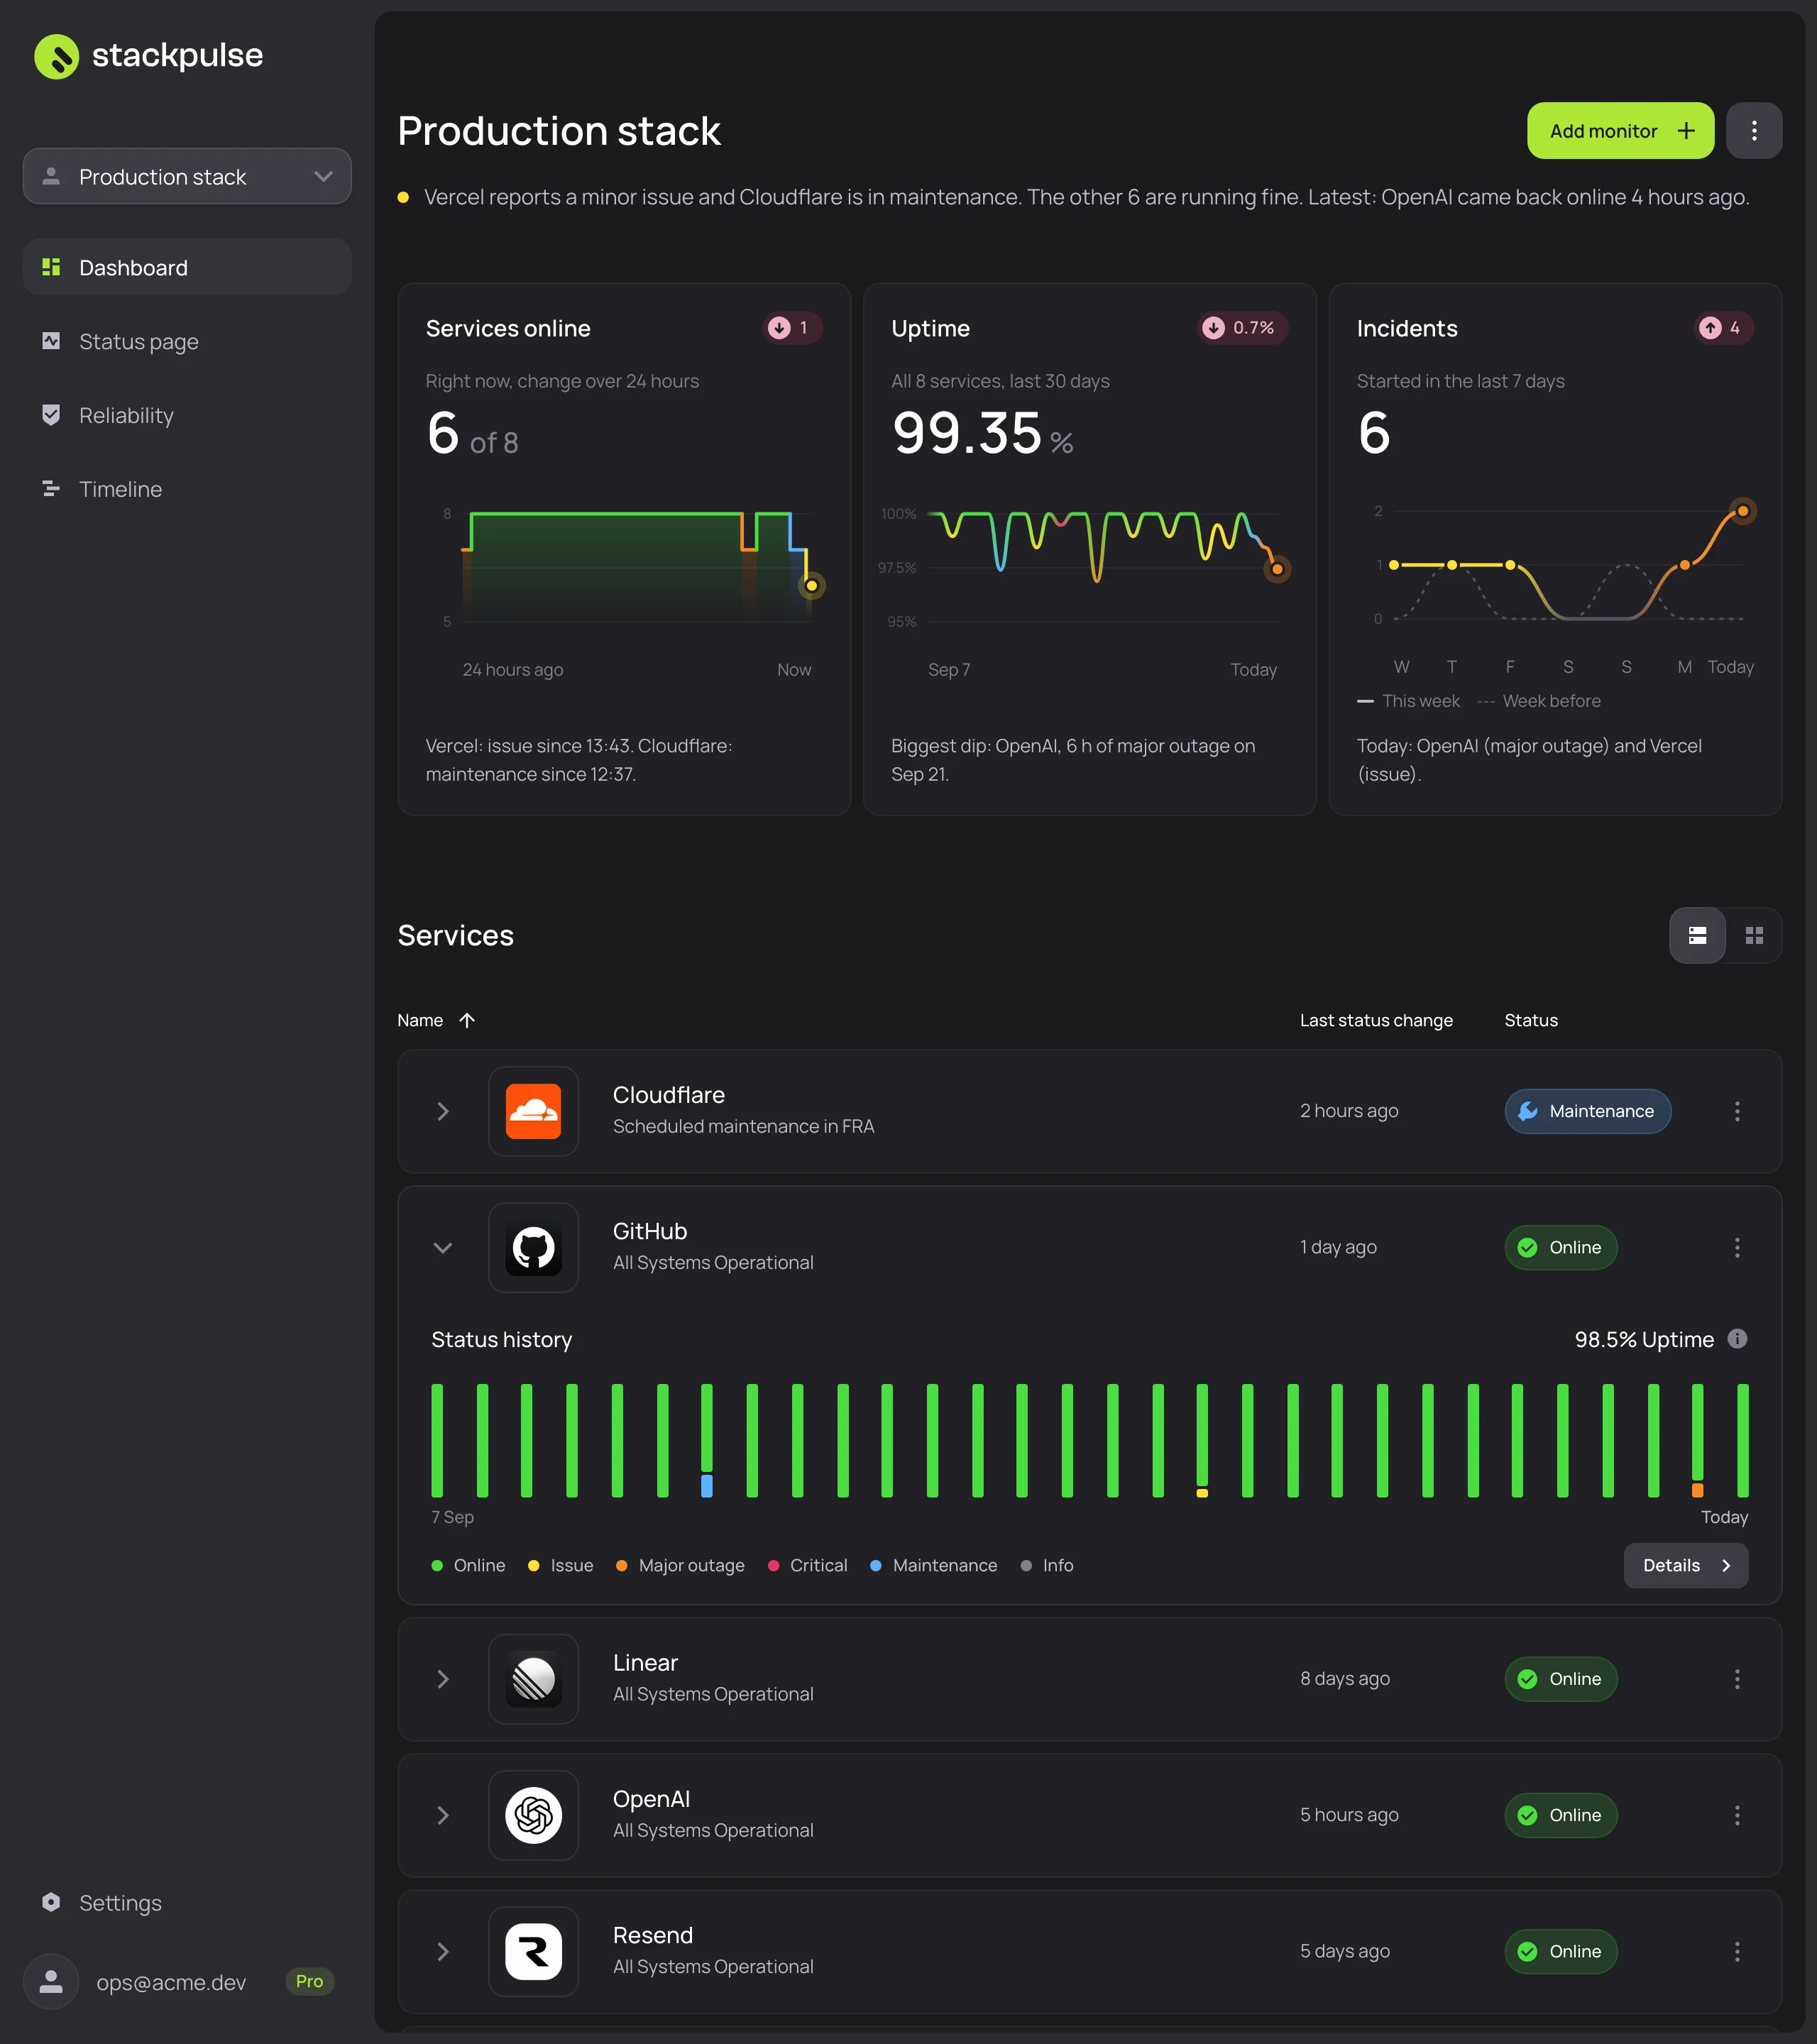
The Stackpulse dashboard: eight services with their status, the latest changes and a service's 30-day history

One tool, 7,900+ services

What you can do with Stackpulse

GitHub logo

GitHub

All Systems Operational

Online

Status history

98.6% Uptime

30 Aug Today

Every service you rely on, on one screen

Pick from 7,900+ official status pages. Stackpulse checks the ones on your dashboards every minute and keeps 30 days of history for each.

Alerts where your team already is

Email, Slack, Discord or any webhook. You hear about a major outage as it happens, and again when the service is back online.

A dashboard for every team or client

Keep production, client projects and internal tools apart. Each dashboard has its own services, and each alert channel covers the dashboards you pick.

A status page you can share

Every dashboard comes with a status page. Add your logo, choose what it shows, and make it public for your team or your customers.

See which part is broken

Status pages list their components. Stackpulse shows them per service, so you know it’s Shopify’s checkout that’s down, not all of Shopify.

Questions, answered

How does Stackpulse know a service is down?

It reads the service’s official status page, the one the company updates during an incident, and records every change. Services on your dashboards are checked every minute.

Which services can I track?

7,970 today, from GitHub, Cloudflare and Stripe to niche tools. Search for yours above, or browse them all on the services page.

How do alerts work?

In Settings → Notifications, choose where alerts go: your email, other addresses, Slack, Discord or any webhook. You hear when a service on your dashboards has a major outage or a critical problem for more than two minutes, and again when it’s back online.

How is this different from an uptime monitor?

An uptime monitor pings your own site. Stackpulse watches the services your product runs on, through their official status pages, so you know when the problem is on GitHub’s or Stripe’s side rather than yours.

Can my whole team get the alerts?

Yes. Add up to ten channels: other email addresses, which confirm before anything is sent, and Slack, Discord or webhook destinations. Each channel can cover every dashboard or only the ones you pick.

What if a status page stops answering?

Stackpulse keeps trying, waiting longer after each failure. After ten minutes the service shows as “Status page unreachable” in grey, so you never mistake a silent page for one that’s fine.

Can I share a status page?

Yes. Every dashboard has its own status page, which you can make public for your team or your customers.

Can I read the data without signing up?

Yes. Every service has a public page with its components and 90 days of history, also as Markdown and JSON, and there’s an RSS feed of status changes at well-known services.

Keep track of all your services and tools in one place.