 Blog
Blog Which kinds of services report the most problems
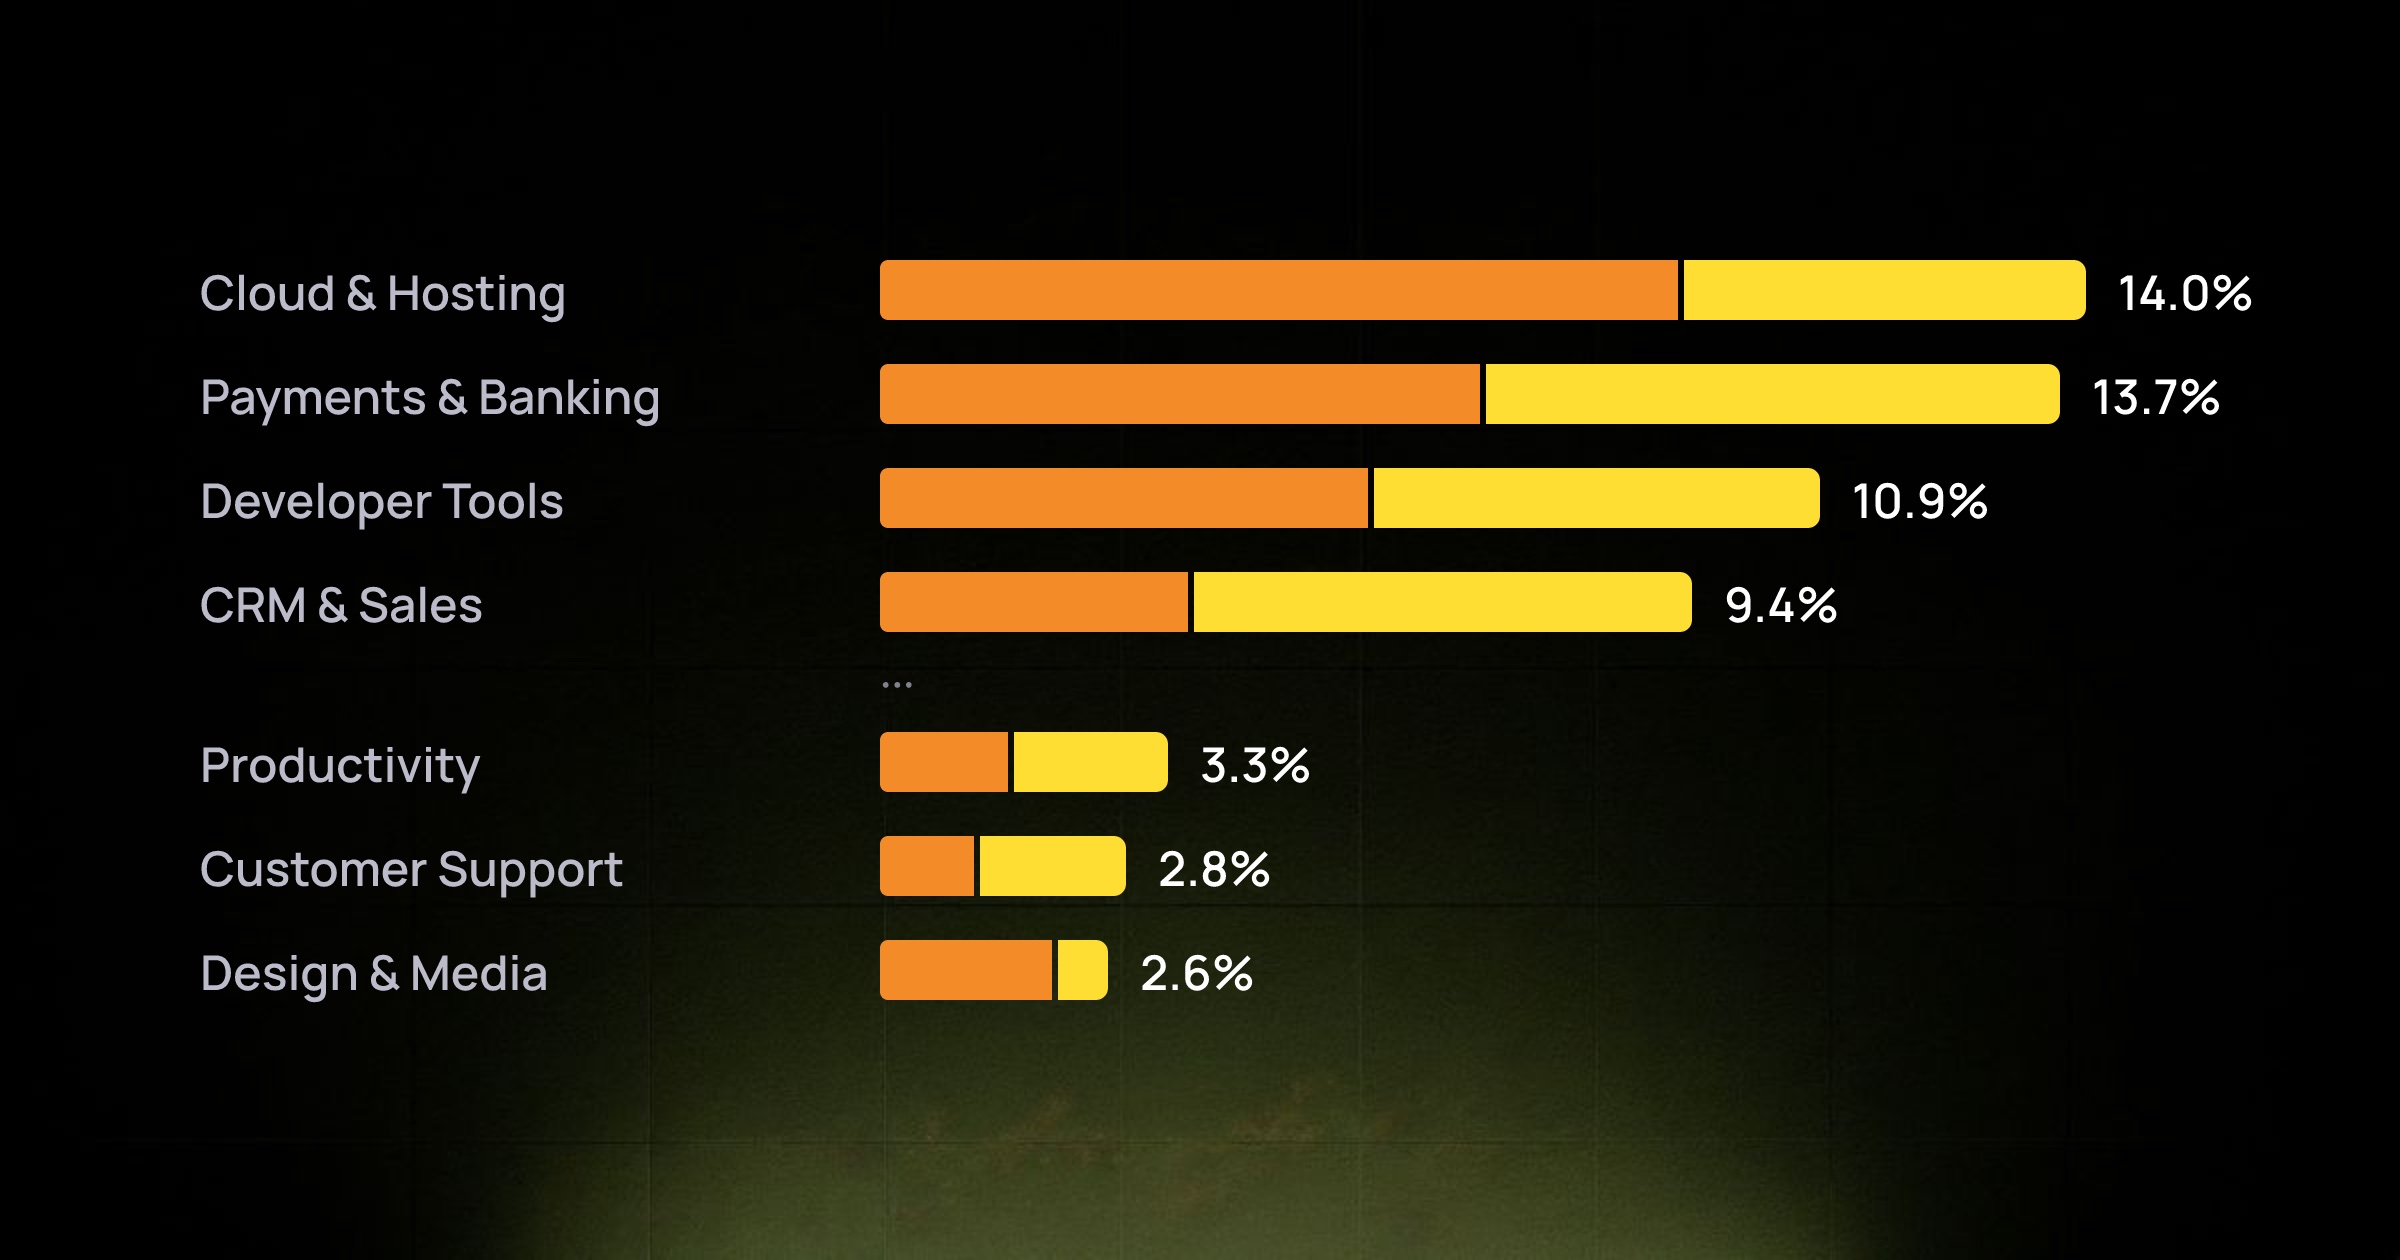
Cloud hosting and payments report a problem on their status page about five times as often as design and customer support tools. Two weeks of official status pages, by category.
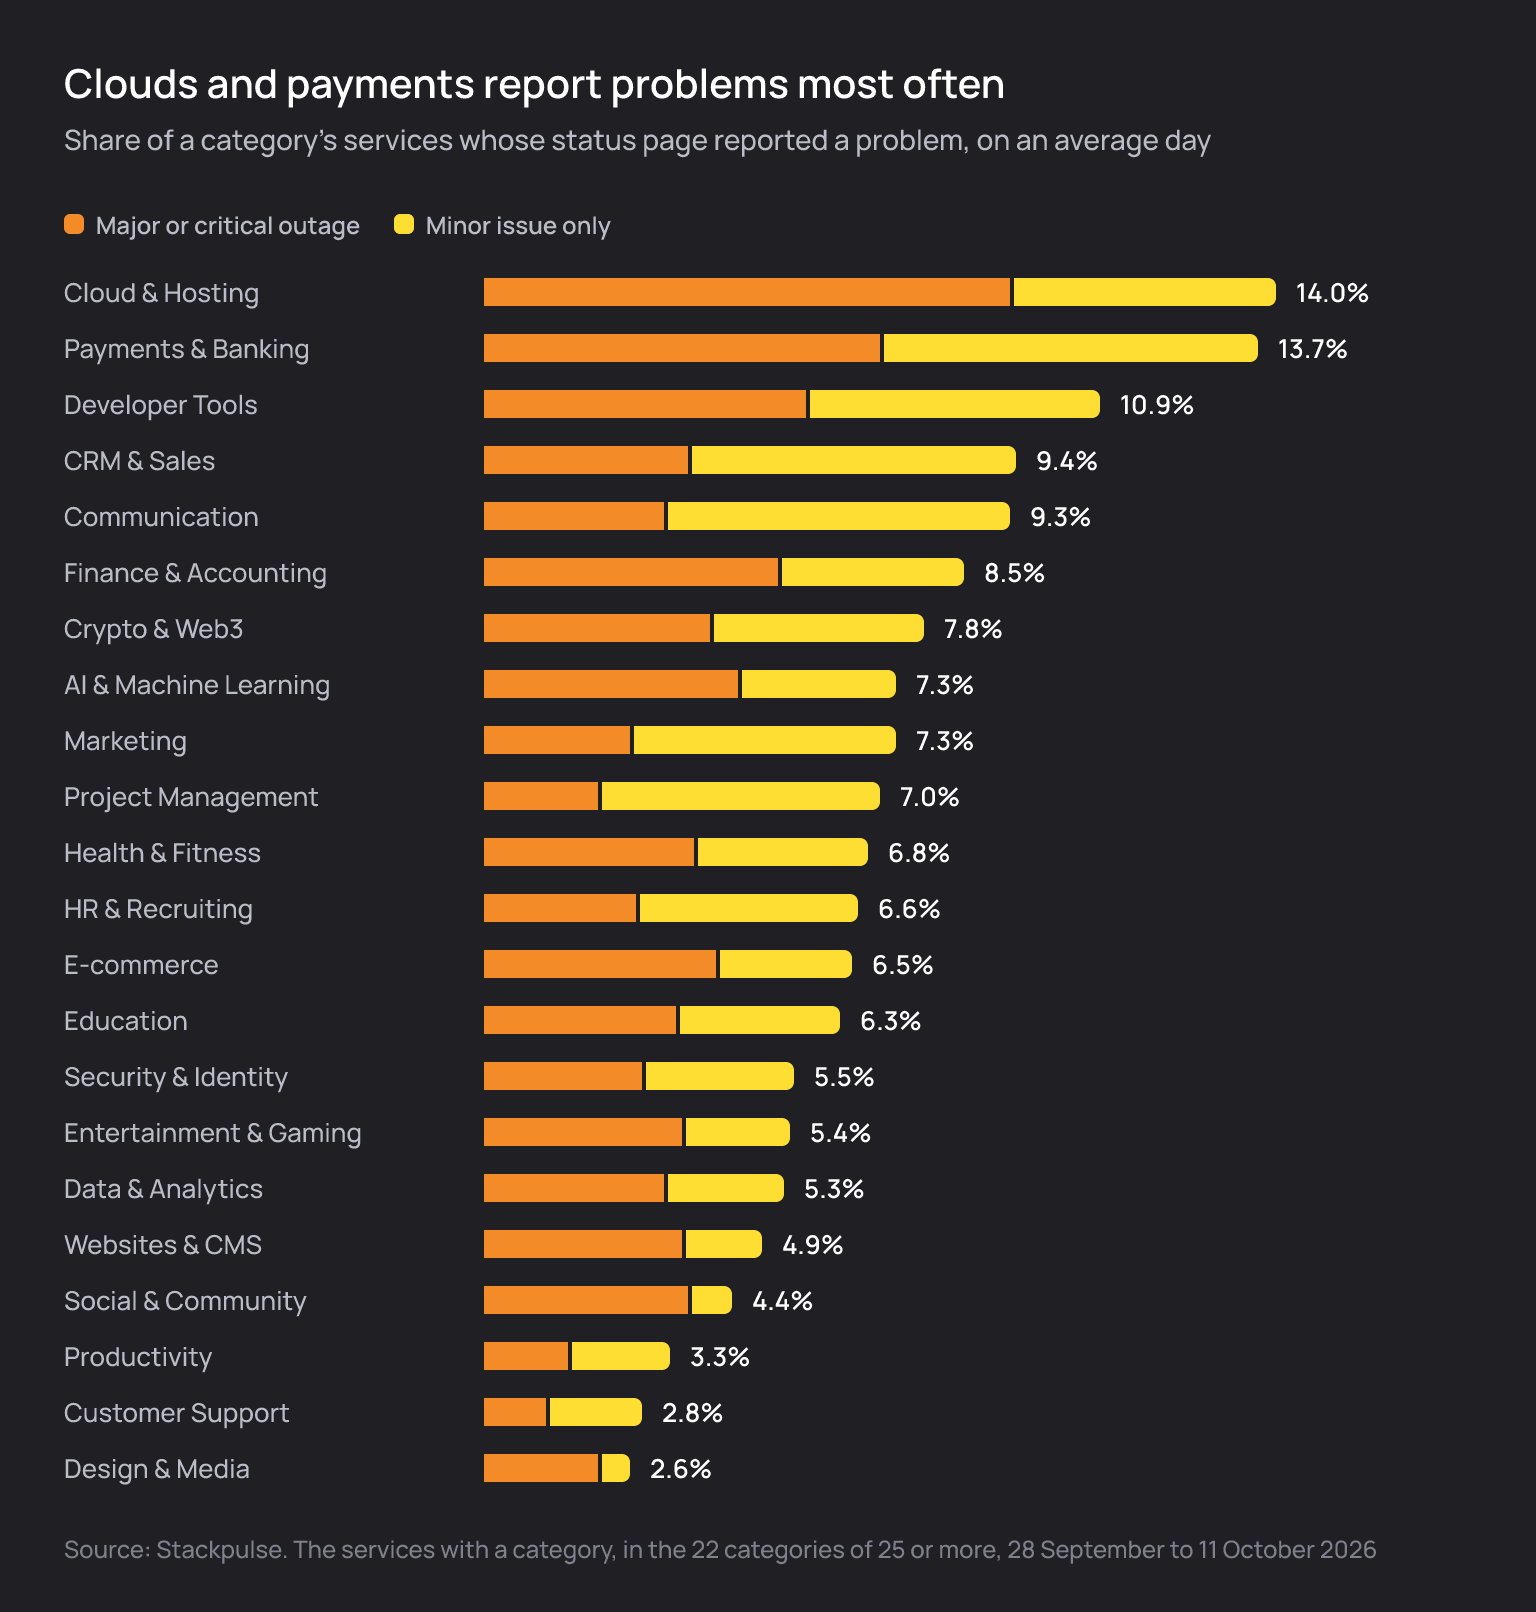
We sorted 1,574 of the best-known services we follow into categories, from cloud hosting to HR software, and counted how often their official status pages reported a problem in the two weeks from 28 September to 11 October. On an average day, 7.3% of them did.
That average hides a wide spread.
Clouds and payments are at the top
On an average day, 14% of cloud and hosting services reported a problem, and most of those were major or critical, not minor. Over the two weeks, 64% of them reported something at least once.
That's less alarming than it sounds. A cloud is dozens of regions and hundreds of products, each with its own row on the status page, and a single region having a bad hour is enough to count. A provider that reports a problem in one region every few days can still be the most reliable thing in your stack.
Payments and banking is right behind at 13.7%, for a similar reason: a payment company depends on hundreds of banks, card schemes and local payment methods, and when one of them fails, the company reports it. On 6 October alone, Paystack reported increased card failures in Nigeria, pawaPay a degradation for Orange in Mali, PPRO a problem with one Belgian bank on Bancontact, and Xendit a disruption at 7-Eleven in the Philippines. Most of those were a bank or a local partner failing rather than the payment company itself, and every one of them broke payments for somebody.
Developer tools come third at 10.9%. CI runners, package registries and code hosting are busy, change constantly, and are used by exactly the people who notice within seconds.
Productivity and design tools almost never report anything
At the other end, only 3.3% of productivity tools, 2.8% of customer support tools and 2.6% of design and media tools reported a problem on a typical day. Over the whole period, fewer than a third of productivity and design tools reported anything at all.
Some of that is real: a note-taking app has fewer moving parts than a payment network. Some of it is probably how these companies write their status pages, with a handful of broad components ("App", "API") rather than one per region or partner, which leaves less to report.
Some categories only report the big ones
The split between minor issues and major outages varies too. Social and community apps reported a problem on only 4.4% of days, but 3.6 points of that were major or critical. When they post, it's usually because something big is broken. Marketing tools are the opposite: 7.3% overall, and most of it minor issues, the kind of "some emails are delayed" notice that a lot of companies never publish.
AI and machine learning services, which feel like they're always down, land in the middle at 7.3%, exactly the average. They have outages often, but so does everyone else.
What it means for your stack
If your product depends on a cloud provider, a payment company and a couple of developer tools, those are the status pages most likely to show something on any given day, and the ones worth watching by component and region rather than by the headline. Most of what they report won't touch you. The trick is knowing quickly which part does.
A status page can only show what a company decides to report, so this measures how often companies report problems as much as how often things break. Services in two categories count in both, and the categories with fewer than 25 services are left out.
Stackpulse watches the official status pages of 9,800+ services, and tells you when one you rely on has a problem.